Contact-tracing is one of the most useful tools in the fight to control the spread of a virus. Authorities in China, Singapore and South Korea have successfully deployed contact-tracing as a mitigation against exponential spread in the COVIS-19 pandemic.
The contact-tracing process involves several steps:
- Registering contacts between people.
- Registering positive tests for the illness.
- Alerting people who have had recent contact with the positively-tested person so they can get tested before they continue the spread.
- Alerting locations where infected people have been so they can be decontaminated.
We set out to create an API to support the contact-tracing process. We identified the following requirements:

Requirements
- Privacy: contact-tracing can be done without compromising the privacy of the participants. This makes it easier to introduce without having to confront data privacy issues.
- Open: the API should support a variety of client technologies (phones, bluetooth armbands etc). We use the OpenAPI REST and JSON standards to ensure compatibility.
- Scalable: contact-tracing involves a lot of real-time data, so the system needs to scale horizontally across multiple data-centers.
- Reliable: the process needs to be fault-tolerant with a shared-nothing cluster model.
- Global: people will need to move freely again, so contract-tracing should ideally work across borders.
- Secure: we use https and randomly generated long UUIDs for participant identification.

API Design
The API documentation is available here and you can try it out live at the playground.

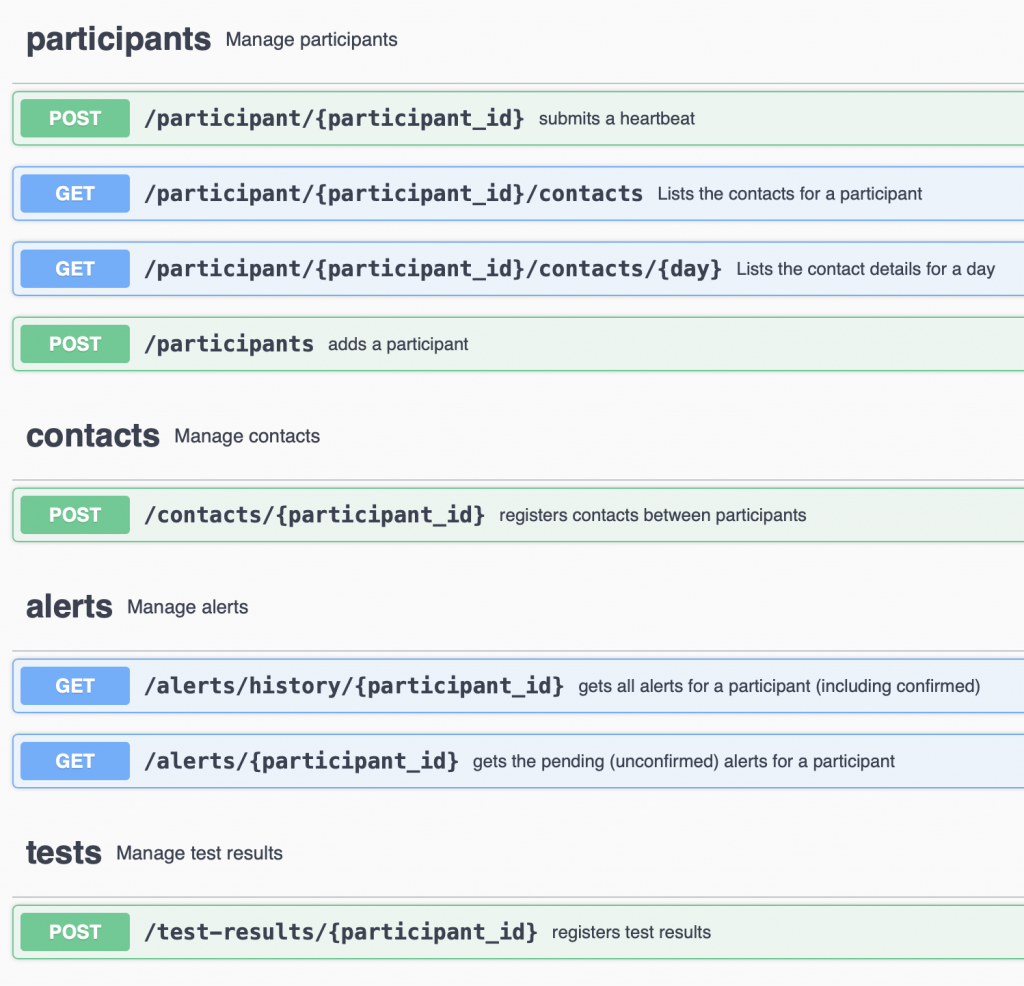
The API consists of the following sections:
- PARTICIPANTS: people.
- LOCATIONS: physical locations such as restaurants, subway cars, elevators.
- CONTACTS: incidents of contact between participants or a contact with a location.
- TESTS: results of tests on participants.
- ALERTS: alerts sent to participants or locations who have recently been exposed to contacts with participants who have received positive test results.

Use case
The following use case illustrates how the API is used from a mobile phone app which is using BLE (low-energy bluetooth) for automated contact gathering.
- Phone registers with the API to get a participant_id (a long, randomly generated UUID) and a participant_broadcast_id (a public id, 13 characters long for BLE, which can be advertised publicly via BLE).
- Phone continuously monitors contacts with other phones, noting the participant_broadcast_ids and sending them to the API as contacts.
- When a participant tests positive, this information is sent to the API and an alert is displayed on the phones of all participants with whom the positively tested participant has had contact within the last 14 days.
- No personal data is ever collected or required by the API.
Scoring contacts
Each contact generates a score which is added to the total score of each participant. A direct, close and long contact with someone who tests positive one day after the contact gets a high score and an indirect, far and brief contact with someone who tests positive 10 days after the contact gets a low score.
When the total score of a participant passes defined thresholds for LOW, MEDIUM and HIGH, they will receive corresponding alerts.
Statistical vs heuristic scoring models
Due to the current lack of historical data, we can only use a heuristic model. When enough data has been collected (contacts (inputs) and test results (outcomes)), a statistical model can be created from that historical data, whose effectiveness (Gini coefficient) at predicting infectiousness can be calculated.
A heuristic model for scoring contacts
Which inputs have we got?
- Interval between the contact and the positive test result (0..10 days)
- Duration of contact (0..20 minutes)
- Distance of contact (0..2m)
The most dangerous contact has a long duration, is at a short distance and occurs within a short time of the positive test result. This contact should score the highest.
The least dangerous contact is of short duration, at a long distance and occurs long before the positive test result. This contact should score the lowest.
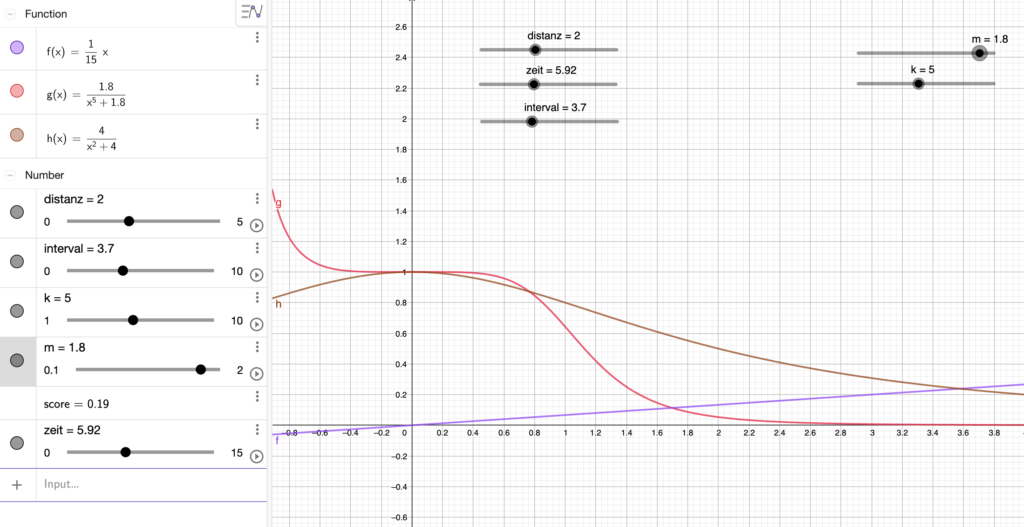
We expect that distance and interval both act exponentially (i.e. the infection risk goes up exponentially at close distance and close to the positive test date). We expect duration to act linearly.
score = f (distance, interval, duration)

distance_score = 2.0 / ((distance_in_meters ** 5) + 2.0)
duration_score = 0.00111 * duration_of_contact_in_seconds
interval_score = 4.0 / ((interval_in_days ** 2) + 4.0)
score = (sqrt(distance_score * duration_score) + interval_score)/2
All contacts count towards an alert – if you have two contacts lasting 15 minutes each, we expect that to be equivalent to a single contact lasting 30 minutes.

Server and DEVOP technologies used for implementation
- Postgres-BDR for shared-nothing, multi-master database replication across data-centers.
- Python3 with Connexion OpenAPI implementation.
- Docker for containerization.
- Linux Docker hosts.
- VMWare VSphere virtualization.
- HAProxy for load balancing and fault tolerance reverse proxying.
- Crond+keepalived for clustered scheduling.
- ReDoc and Swagger-UI for API documentation and playground.
Load testing
Using apache bench utility to load the API (20000×5 contacts, request concurrency 100):
$ cat json.txt
[
	{
		"with_participant_broadcast_id":"jij0zc2ubQPbT",
		"from_timestamp":"2020-04-02T09:12:33.001Z",
		"until_timestamp":"2020-04-02T09:22:33.001Z",
		"distance_in_meters":1
	},
	{
		"with_participant_broadcast_id":"hvoLG0hAnkLtS",
		"from_timestamp":"2020-04-02T09:12:33.001Z",
		"until_timestamp":"2020-04-02T09:22:33.001Z",
		"distance_in_meters":1
	},
	{
		"with_participant_broadcast_id":"jREYrIrqyYy7m",
		"from_timestamp":"2020-04-02T09:12:33.001Z",
		"until_timestamp":"2020-04-02T09:22:33.001Z",
		"distance_in_meters":1
	},
	{
		"with_participant_broadcast_id":"bFnfq4al6UC9v",
		"from_timestamp":"2020-04-02T09:12:33.001Z",
		"until_timestamp":"2020-04-02T09:22:33.001Z",
		"distance_in_meters":1
	},
	{
		"with_participant_broadcast_id":"fbY0fKs2XVbJM",
		"from_timestamp":"2020-04-02T09:12:33.001Z",
		"until_timestamp":"2020-04-02T09:22:33.001Z",
		"distance_in_meters":1
	}
]
$ ab -p json.txt -T application/json -c 100 -n 20000 https://contact-tracing.armstrongconsulting.com/api/v1/contacts/0007a8f0-323f-49ec-9e60-0c04967bd09b

This is ApacheBench, Version 2.3 <$Revision: 1843412 $>
Copyright 1996 Adam Twiss, Zeus Technology Ltd, http://www.zeustech.net/
Licensed to The Apache Software Foundation, http://www.apache.org/

Benchmarking contact-tracing.armstrongconsulting.com (be patient)
Completed 2000 requests
Completed 4000 requests
Completed 6000 requests
Completed 8000 requests
Completed 10000 requests
Completed 12000 requests
Completed 14000 requests
Completed 16000 requests
Completed 18000 requests
Completed 20000 requests
Finished 20000 requests


Server Software:        TornadoServer/4.4.2
Server Hostname:        contact-tracing.armstrongconsulting.com
Server Port:            443
SSL/TLS Protocol:       TLSv1.2,ECDHE-RSA-AES256-GCM-SHA384,2048,256
Server Temp Key:        ECDH X25519 253 bits
TLS Server Name:        contact-tracing.armstrongconsulting.com

Document Path:          /api/v1/contacts/0007a8f0-323f-49ec-9e60-0c04967bd09b
Document Length:        10 bytes

Concurrency Level:      100
Time taken for tests:   296.288 seconds
Complete requests:      20000
Failed requests:        0
Total transferred:      4220000 bytes
Total body sent:        22140000
HTML transferred:       200000 bytes
Requests per second:    67.50 [#/sec] (mean)
Time per request:       1481.442 [ms] (mean)
Time per request:       14.814 [ms] (mean, across all concurrent requests)
Transfer rate:          13.91 [Kbytes/sec] received
                        72.97 kb/s sent
                        86.88 kb/s total

Connection Times (ms)
              min  mean[+/-sd] median   max
Connect:       35  714 259.7    785    1234
Processing:    23  763 142.9    772    1580
Waiting:       20  761 143.2    770    1579
Total:         67 1478 321.5   1571    2641

Percentage of the requests served within a certain time (ms)
  50%   1571
  66%   1609
  75%   1649
  80%   1668
  90%   1732
  95%   1782
  98%   1925
  99%   2047
 100%   2641 (longest request)
Capacity requirements
Using the population of Western Europe (200M) as a reference point, and assuming that each person has close contact (<2m) with 20 people per day, thats 4B contacts per day. Assuming those contacts occur evenly distributed over a 16 hour period, and that the clients aggregate 10 contacts before sending them, that’s a load of about 700 concurrent calls to the /contacts request per second.
The requests are distributed by reverse proxies over a farm of server clusters. Each cluster of servers has its own database (with multi-master, asynchronous replication). The size of the farm is only limited by the requirement to replicate the databases. Ideally, the
If the servers cannot handle peak requests, the clients will receive a http 503, temporarily unavailable, response. The clients should back off and try again after a random delay.
Based on this volume of requests, it should be possible to serve 200M clients with 30 servers, organised into 3 (geographically separated for fault tolerance) clusters of 10 servers each, each cluster sharing a database.
Database disk capacity: 2B contacts per day require approximately 500GB of disk. If we assume that we need to maintain data online for 14 days, the database size will be below 10TB.
Internet connection capacity: Each contact request is about 5K (without compression), so approximately 10TB of network traffic per day or about 200Mbps over a 16 hour day. Compression of requests and response payloads will reduce these requirements.
See also
Automated contact-tracing via Smartphone with Bluetooth Low-Energy contact detection
Using statistical scoring models to enhance contact-tracing effectiveness
How to get in touch
Armstrong Consulting Services GmbH
Zieglergasse 1/14
1070 Vienna
Austria
healthcare@armstrongconsulting.com
Tel: +43-1-5248737-11
Mobile: +43-699-1235-4347

Pingback: Contact-tracing with Bluetooth Low-Energy contact detection – blog.armstrongconsulting.com
Pingback: Using statistical scoring models to enhance contact-tracing effectiveness – blog.armstrongconsulting.com
Pingback: A contact-tracing armband – blog.armstrongconsulting.com